Bio-Layer Interferometry
Bio Layer Interferometry uses optical interferometry as means of detection. The technology uses light waves to infer the thickness of bio layer(s) on the sensor.
Sartorius’s BLI Octet systems offer real-time biomolecular interactions analysis in micro-volume samples, characterizing binding affinity, binding kinetics, and concentration.
Bio-Layer Interferometry (BLI) is a label-free technology for measuring biomolecular interactions. It is an optical analytical technique that analyzes the interference pattern of white light reflected from two surfaces: a layer of immobilized protein on the biosensor tip, and an internal reference layer. Only molecules binding to or dissociating from the biosensor can shift the interference pattern and generate a response profile on the FortéBio Octet® System. Unbound molecules, changes in the refractive index of the surrounding medium, or changes in flow rate do not affect the interference pattern. This is a unique characteristic of BLI and extends its capability to perform in crude samples used in applications for protein: protein binding, quantitation, affinity, and kinetics. We have a range of solutions available from simple benchtop solutions, through to high throughput systems which can monitor up to 96 sensors in parallel.
BLI systems have a number of advantages including:
- No microfluidic components: measure the samples directly in microplates
- Up to 96 simultaneous measurements can be done on unpurified samples such as cell culture supernatants, lysates or complex mixtures in routine high throughput
- High-throughput of crude samples is particularly useful for epitope binning, quantification, off-rate ranking or large screening assays where sample purification is not possible for efficient workflows
- Large number of different biosensors available giving a broad range of surface chemistries to design experiments with maximum flexibility
BLI - technology
Bio Layer Interferometry uses optical interferometry as means of detection. The technology uses light waves to infer the thickness of bio layer(s) on the sensor (2), (3), (5).
Optical interference
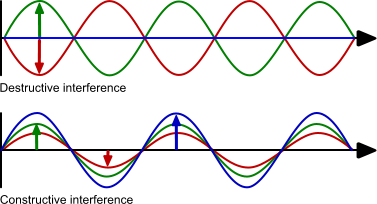
A light wave has a wavelength, amplitude and direction. The wavelength is determining the colour of the light wave. The amplitude is the intensity of the light wave. Visible light ranges from 400 nm (violet) to 700 nm (red) (1), (4).
When two light waves interact the result of the interaction depends on the phase and amplitude of the waves. If the waves have the same amplitude but opposite phase (red and green) they will cancel out. This is called destructive interference. If the waves have the same phase and amplitude the resulting wave has the same phase but the amplitude is the sum of the two amplitudes. This is called constructive interference. The two examples are at the extreme of the possibilities because most of the interferences are a combination of phase shift and amplitude change.
Sensor construction
The sensor is attached to an optical fibre which guides the light beams from the light source to the sensor tip and back to the spectrometer. Between the sensor tip and the optical fibre is an air gap to suppress internal reflection. The sensor tip is made of high grade optical glass (SiO2) with an index of refraction of about 1.4 - 1.5 or a high grade polymer like polystyrene or polyethylene with an index of refraction between 1.3 – 1.8.
Between the optical glass layers is the first refraction layer made of Ta2O5 with an index of refraction 2.1. The layer is made by conventional vapour deposition and is typically between 5 and 30 nm. The distal optical glass layer is between 400 and 1000 nm. The tip of the optical layer is modified with for instance bifunctional reagents containing a siloxane group for chemical attachment to SiO2 and a hydroxyl, amine, carboxyl or other reactive group to make a surface suitable for ligand immobilization.
Layer thickness
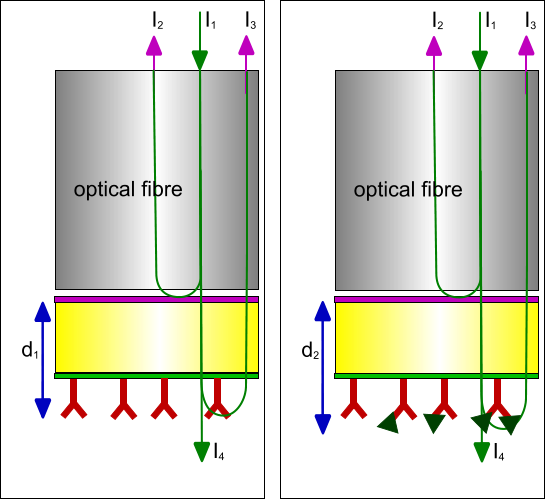
In Bio-Layer Interferometry a white light source with all wavelengths from the visible light is used. The white light (I1) is send down an optical glass fibre and reflected back (I2) at the glass – optical surface and the interface between the surface chemistry and the solution (I3). All the light that is not reflected travels through the sensor into the liquid (I4). Although the reflected light (I2) from the first reflective layer is constant, the reflected light from the surface – liquid boundary is not. If molecules attach or detach the (optical) thickness of this layer is changed and consequently the path length the reflected light. Hence, the path length of the reflected light changes and therefore the interference at the detector changes.
Because only molecules which are part of the layer thickness contribute to the path length change, the composition of the liquid below the tip has no influence on the signal. This makes it possible to do measurements in opaque and high optical active solutions, like DMSO and glycerol.
The total wavelength-dependent intensity of the reflected wavelength is:

Where I is the intensity of the reflected light, I2 and I3 the intensities of the two reflected light beams, Δ is the optical path difference and λ is the wavelength. Assuming that the intensities of both of the reflected light are equal the formula becomes:

This formula makes it possible to determine the optical thickness of the extra layer based on the intensity of the reflected light and the wavelength.
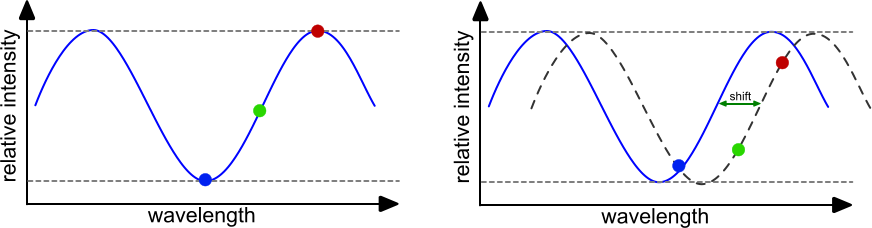
The reflected light from both interfaces is compared per wavelength for interferences. For each wavelength the amplitude (intensity) is determined and plotted in an intensity plot. When the initial values are set, any binding of dissociation to the sensor tip will change the interference pattern and therefore the intensity plot. When molecules bind to the sensor the interferometric pattern shifts to the right and when molecules dissociate the interferometric pattern shifts to the left. The measurement of the interferometric pattern can be done in real-time thus enabling the monitoring the interaction of molecules. By plotting the changes as a function of time an association/dissociation curve is obtained.
Like SPR, BLI requires the immobilization of a ligand to the sensor. In principle the same chemistries and modifications are possible as with SPR. BLI does not use a flow, but the sensor is dipped in the analyte solution and vibrated to minimize analyte depletion around the sensor tip. With this set-up the analyte consumption is low and association and dissociation times can be long compared to most SPR instruments.
BLI - Applications
The applications of the BLI-technology and the Forte-bio Octet instruments are many. Choose your grey topic of interest on the image below.

Kinetics
Use BLI for rapid kinetic measurements. Determine de ka, kd and KD in one run. Because BLI is not sensitive to the liquid matrix containing your sample, screening of un-purified samples is simple and easy by just dipping the sensor in. In addition, construct affinity isotherm plots to rank the samples and determine which are best suited for your application.
Characterise your antibodies with epitope binning to select the ones with different epitopes, perform isotyping and select antibody pairs which can be used in ELISA’s.
Antigen-Antibody
Use BLI to characterize antibodies from hybridoma supernatants, phage lysates or purified samples in real time, while eliminating any sample preparation beyond an optional dilution step. Octet instruments can read from 2 to 96 samples simultaneously in automated format using a standard microplate for rapid determination of binding affinity constants (KD), association rates (ka or on-rate) and dissociation rates (kd or off-rate) for antibody-antigen binding. In addition to complete kinetic characterization, equilibrium assays can be used to determine KD, or simple binding assays performed to rapidly evaluate relative affinity or screen large numbers of samples. BLI biosensors are compatible with a wide range of sample types and buffers, including cell extracts, serum, and media. The standard microplate format combined with disposable Dip and Read biosensor technology enables automated, highly parallel processing on the Octet system in sample volumes as low as 40 µL.
Glycosylation
Drug product glycosylation is a critical quality attribute (CQA) due to its potential impact on pharmacokinetics properties and stability of the product. ForteBio’s Sialic Acid (GlyS) Kit enables high-throughput relative screening of sialic acid content in crude and purified samples. There is no need for sample purification or glycan digestion steps. 1000 clones can be screened in just under 10 hours on the Octet HTX system.
A combination of the Sialic Acid (GlyS) Kit and Protein A biosensors, or any of the ForteBio quantitation biosensors can be used to perform titer and sialic acid content screening on the same samples using Octet systems. Octet Data Analysis HT software allows titer data to be combined with sialic acid content data. The ability to view and choose from desired titer and sialylation levels at the same time provides more in-depth knowledge that facilitates more informed decisions.
ADCC
Antibody-mediated cell-dependent cytotoxicity (ADCC) (6) is the major way of action of therapeutic monoclonal antibodies. The three classes of Fc gamma receptors (Fc³Rs) are membrane glycoproteins with affinity for the Fc region of immunoglobulin G (IgG). Induction of ADCC by an antibody depends on its binding affinity to both the target and the Fc³R. Monitoring the maturation of the antibodies is of great importance since specificity and high affinity is beneficial for safety and efficacy of therapeutic antibodies.
BLI makes it possible to check the interaction between the Fc³R – IgG – Target in one experiment. This gives valuable information on the individual kinetics and the overall kinetics of the system.
Pharmacokinetics
High detection sensitivity, a wide dynamic range, and streamlined workflows that shave hours or even days from standard processes make the Octet system a compelling alternative to ELISA for pharmacokinetic and pharmacodynamic studies. Anti-drug immune responses can be precisely characterized in serum samples, providing a detailed profile of antibody isotype, specificity, and affinity.
Potency
The Octet platform offers a fast, accurate, and robust solution for measuring potency of a drug molecule. The speed of the Octet systems allow for rapid Design of Experiment results which can aid in development, optimization, and potential validation practices. The system is ideal for characterizing biotherapeutic activity and monitoring potency and stability.
Binding kinetics assays and specifically affinity constant (KD) analysis are increasingly being used for biological products lot release. Regulatory requirements necessitate that such products be QC tested using methods that are robust and have been appropriately developed, qualified and validated under GMP conditions. Octet platforms come with a complete GxP package that include instrument installation and qualification (IQOQ) kits, performance qualification (PQ) kits and 21 CFR Part 11-compliant software. In addition, we provide users with software and biosensor validation support that facilitates compliance with GMP requirements.
Rely on rapid development, optimization and validation of assay methods for various applications under GLP and for QC laboratories.
BLI - Instruments
Octet systems
FortéBio’s BLI Octet systems offer real-time biomolecular interactions analysis in micro-volume samples, characterizing binding affinity, binding kinetics, and concentration. BLI systems have a number of advantages including:
- No microfluidic components: measure the samples directly in microplates
- Up to 96 simultaneous measurements can be done on unpurified samples such as cell culture supernatants, lysates or complex mixtures in routine high throughput
- High-throughput of crude samples is particularly useful for epitope binning, quantification, off-rate ranking or large screening assays where sample purification is not possible for efficient workflows
- Large number of different biosensors available giving a broad range of surface chemistries to design experiments with maximum flexibility
Octet® N1 system
Label-free analysis in a drop.
The Octet® N1 system label-free analysis to individual researchers, enabling protein quantitation and kinetics experiments in only 4 µL of sample – right at your own lab bench. BLI technology enables sensitive, real-time detection even in crude media.
Goto the Octet® N1 webpage for more information.
Octet R8
8-Channel system for rapid assay development.
This system is ideal for automation of small and large molecule characterization. The microfluidic-free method eliminates sample loading times and time-consuming cleaning steps between measurements. This allows the quantitation of 96 samples in 32 minutes and kinetic screening of 64 samples in 1.5 hours, with use of up to 8 channels, enabling flexibility in sample throughput based on need.
With the optional plate cover, you can minimize sample evaporation even during long measuring times and thus determine long dissociation rates of up to 4 hours to characterize high-affinity binding systems.
Goto the Octet webpage for more information.
Octet HTX
High throughput quantitation and kinetics characterization.
The Octet HTX monitors up to 96 measurements simultaneously, enabling label-free detection for protein quantitation and kinetic characterization at unmatched speed. It can read 8, 16, 32, 48 or 96 wells in parallel, allowing you to tailor your assay design to maximise analytical throughput or sensitivity. Furthermore, the Octet HTX instrument is automation ready and robot compatible for microplate and biosensor tray loading.
BLI Suppliers
Creative Biostructure
Creative Biostructure has accumulated a lot of experience from many label-free real-time BLI analysis projects of interacting molecules. BLI services have been proven reliable by customers from academia and the pharmaceutical/diagnostic industries.
For research on coronavirus infection, we can provide you with:
- BLI project consultations and experiment design
- BLI assay development and optimization
- Detection and analysis of binding kinetics of protein or other biomolecules based on BLI technology
- Antibody characterization, such as affinity detection of antibody and antigen/complement
- Consistency evaluation of protein/antibody to guarantee quality
Sartorius
Sartorius accelerates discovery and development of vital medicines that cure diseases. We do that by enabling life science researchers to rapidly analyze molecules involved in biological processes, by providing best-in-class products, by knowing the science behind our customers’ research, by providing first-class service, and by being a trusted partner in finding solutions to research challenges.
We offer solutions for biophysical analysis, including real-time analysis of biomolecular interactions (protein quantification and characterization of protein-protein interactions, etc.) in micro-volume sample sizes, providing information on binding affinity, binding kinetics, and concentration. Our products include instrumentation, software, biosensors, and supporting services. Our customers perform crucial work in life sciences research across academic, government and industrial settings, including pharmaceutical research, development and manufacturing.
website: www.sartorius.com
e-mail:
References
| (1) | Chapter 37: Interference of light. |
| (2) | Sartorius website. Goto reference |
| (3) | Chen, D.Fiber optic direct-sensing bioprobe using phase-tracking approache. United States Patent(1996). |
| (4) | Pedrotti, L. S.Fundamentals of photonics / Basic physical optics. |
| (5) | Tan, H., D. Chen, Y. Tan, et al.Fiber-optic assay apparatus based on phase-shift interferometry. United States Patent(2004). |
| (6) | Nimmerjahn, F. and J. V. Ravetch Fc[gamma] receptors as regulators of immune responses. Nat Rev Immunol 8: 34-47; (2008). Goto reference |