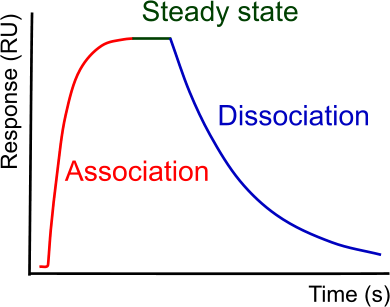
Sensorgrams
In Biomolecular interaction analysis, the measured signal versus time, is often called a Sensorgram. The shape of the interaction curve is the same regardless of the technique of measurement. If measurements are done at steady state (equilibrium) a different kind of plot is made (see figure).
This tutorial will explain how a sensorgram should look like and give examples on how to recognize a good from a bad sensorgram. In addition, you will learn to identify what is wrong and how to avoid this in your own data. Furthermore, you will learn how to present your data in such a way that you can convince your readers that the results are reliable.
At the end of this chapter, there is a quiz to test your self.
Use the zoom function of some of the figures to get a better view. When the zoom function is availble it is indicated by an icon in the right bottom corner of the figure.